Advantages of FLI custom Tunes over Cobb’s Base maps
Advantages of FLI custom Tunes over Cobb’s Base maps
Advantages of FLI custom Tunes over Cobb’s Base maps-
Todays modern world of technology has advanced in many ways, especially regarding automotive Electronic Control Units or ECU’s. In this article, we will be talking about the advantages of FLI custom made maps compared to off the shelf base maps. In the examples used, we will specifically be comparing Cobb Tuning’s base maps vs. FLI custom made maps in Subaru WRX, STI, FXT and LGT turbocharged cars.
This article is not meant to critic Cobb Tuning’s base maps, it is to point out the advantages of FLI custom made maps. Creating nationwide base maps is extremely hard and Cobb does a fantastic job in doing so. To create a nation wide base map, you must consider at all factors (weather, elevation, fuel quality, etc.).
*All horsepower and torque readings in the following dyno graphs are measured at the wheels by FLI’s in house Mustang AWD 500SE chassis dyno.
04 STI Stage 2-
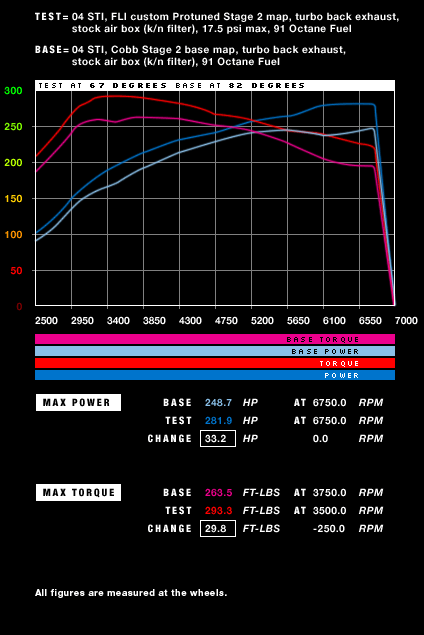
For the first example, we will talk about a 2004 Subaru STI fitted with a 3 inch turbo back exhaust system and a K&N panel air filter (FLI/Cobb Stage 2). As you can see by this dyno graph, FLI increased peak horsepower by 33 at 6750 rpm and increased peak torque by 30 at 3500 rpm (250 rpm sooner then Cobb’s map). As you can see FLI’s custom map creates lots more torque and horsepower throughout the power band.
04 WRX Stage 3-
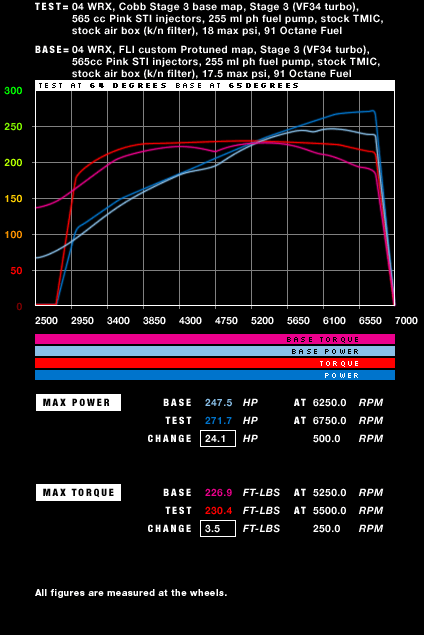
The second example is a 2004 Subaru WRX fitted with a VF34 turbo, STI pink fuel injectors, Walbro 255 ml/ph in tank fuel pump, 3 inch turbo back exhaust system, factory air box (K&N panel air filter) and factory top mount intercooler (FLI/Cobb Stage 3). As you can see on this dyno graph, FLI increased peak horsepower by 24 at 6750 rpm and peak torque by 4 at 5500 rpm. You can also see that FLI’s map is much more smoother throughout the power band with increased horsepower and torque.
07 LGT Spec B Stage 1-
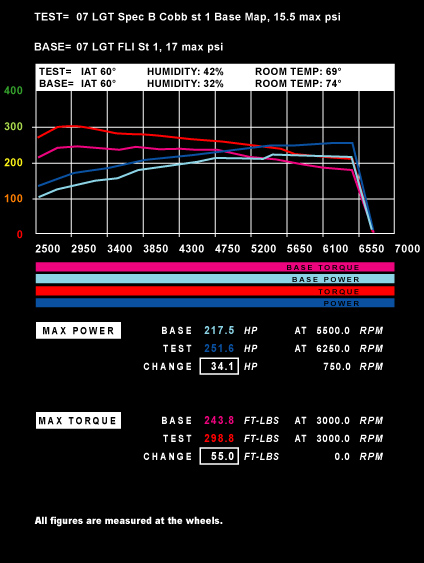
The third example is a 2007 Subaru Legacy Spec B fitted with a Cobb Tuning 3 inch catless down pipe and a K&N panel air filter (FLI/Cobb Stage 1). As you can see by this dyno graph, FLI increased peak horsepower by 34 at 6250 rpm and peak torque by 55 at 3000 rpm. You can see that FLI’s custom map produces more horsepower and torque throughout the power band.
08 FXT Stage 2-
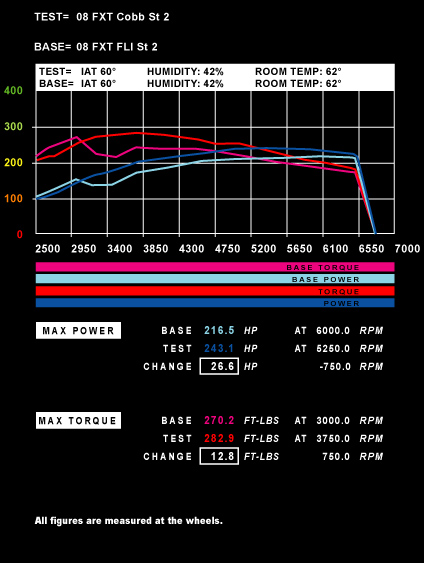
The forth example is a 2008 Subaru Forester XT Sport fitted with a Cobb Tuning 3 inch catless turbo back exhaust system and a K&N panel air filter (FLI/Cobb Stage 2). On this dyno graph, you can see that FLI’s custom map produces 27 peak horsepower at 5250 rpm (750 rpm sooner then Cobb’s map) and 13 peak torque at 3750 rpm. Take note at the difference of the horsepower and torque curve throughout the power band.
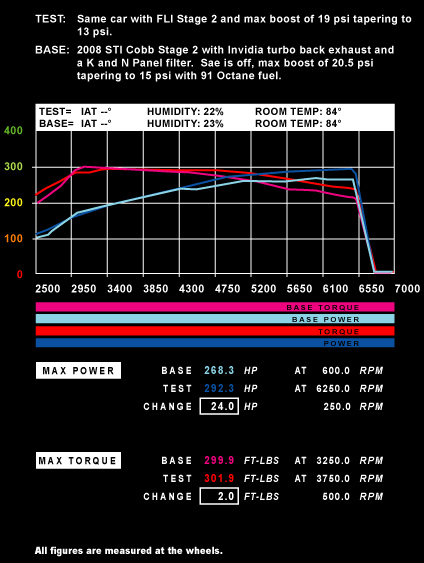
08 STI Stage 2-
The last example we will talk about is a 2008 Subaru STI fitted with an Invidia 3 inch turbo back exhaust system, factory air box (K&N panel air filter) and factory top mount intercooler (FLI/Cobb Stage 2). On this dyno graph you can see that FLI’s custom map produces 292 whp at 6250 rpm vs. Cobb’s 268 whp at 6000 rpm and 302 wtq with FLI’s map vs. 299 wtq from Cobb’s map. Take a look closer at the two maps. With FLI’s map there is a 24 whp and wtq gain between 4300-6750 rpm!
In Summary, as you can see that FLI’s custom made maps are overall more efficient and produce more power then Cobb Tuning’s off the shelf base maps. Once again, Cobb did a fantastic job in creating nationwide base maps but there is always room for improvement due to local factors like air density and fuel quality. FLI looks forward to created custom maps for customers who are looking for more power and overall a more efficient running engine at a reasonable price.


